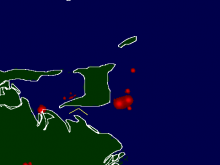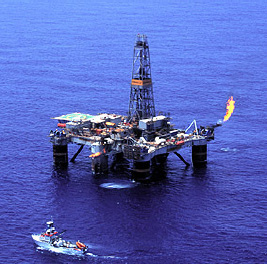
 Take a look at the two images to the right. The first is of an offshore platform flaring gas. The second (click to enlarge) is a computer-enhanced satellite photo of gas flaring off the coast of Trinidad and Tobago. Yes, if you use the right technique, you now can document flaring from space.
Why is that significant? It means that we now have some tools by which we can double-check the flaring figures provided by government and energy companies, and fill in data gaps where such information was not even being offered (at least not in updated figures).
Why care at all about gas flaring? First off, it's a waste: the equivalent of 5.5% of the world's natural gas production is burned off every year, in an age where we can ill-afford to waste energy. Second, the flaring produces air pollution (soot, carbon monoxide) and contributes substantially to global climate change: globally flaring emits about 400 million tons of carbon dioxide (CO2) emissions every year.

But The Temas Blog, get's to the true focus of this post: what does the study tell us about the LAC nations among the 60 nations studied? The thumbnails for the 1995-2006 flaring trend charts for 10 LAC nations are provided below — click each to enlarge and view. (more…)