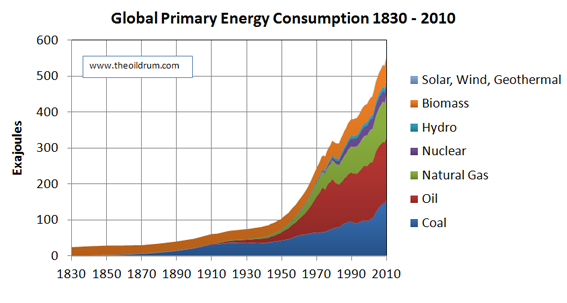
The Oil Drum... post goes into the global consumption of energy and provides a dataset in Excel for researchers on global primary energy consumption from 1830 to 2010. In other words, the energy contained in fossil fuels, uranium, and biomass in their raw form before processing into electricity, heat, or liquid fuel, and direct electricity production from hydro, solar, wind, and geothermal. The dataset, based on an assessment of seven different data sources, shows the following:
- We are now burning 10 times as much energy as a century ago to provide the goods and services we consume.
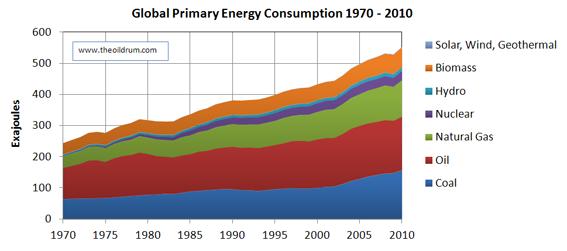
- Energy consumption is still increasing rapidly, with an approximate 550 exajoules (523 Quadrillion BTUs) consumed at the primary energy level in 2010.
- Of this total 80% was provided by fossil fuels, 11.3% by bio-energy mainly from wood combustion, 5.5% from nuclear, 2.2% from hydro, and 0.4% from other renewable energy sources.
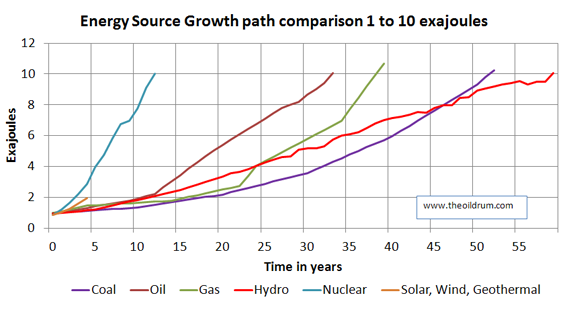
- The historic time for each energy source to grow from 1 to 10 exajoules in primary energy production was 12 years for nuclear, 33 years for crude oil, 39 years for natural gas, 52 years for coal, and 59 years for hydro-power.
A graphical depiction of the data and comparison of sources can be found below the fold.
The charts below can be found in the Excel file, source attribution can be found at the bottom. The data in the charts is normally displayed in exajoules (10^18 joules) and in a few cases in Quadrillion (10^15) BTU's for data comparison. The following conversion factors were used:
- 1 joule = 9.48×10⁻⁴ BTU.
- 1 boe (barrel of oil equivalent) = 5.45 x 10⁶ BTU.
- 1 cubic feet of natural gas = 983 BTU.
- 1 metric ton of coal = 22.72 * 106 BTU.
- 1 exajoule = 174 million barrels of oil equivalent.
Global Primary Energy Consumption per source stacked and individual graphs
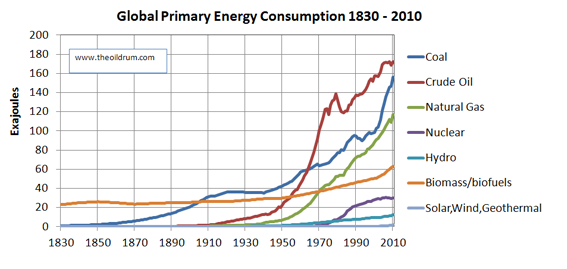
The first two charts in this section display the evolution of primary energy consumption broken down by energy sources. Figure 1 shows the evolution from 1830 to 2010 and Figure 2 from 1970 to 2010. The same is shown in Figures 3 and 4 but by the individual curves of each energy source.


Growth path comparison of Primary Energy delivered per source
In this section, a dataset is graphically depicted wherein a comparison is made of the number of years for each energy source to grow from 1 exajoule to 10 exajoules of energy production. By comparing these, it can be shown how long different energy sources took to become influential in global energy supply.

Comparison of different Primary Energy Data sources